| design | 2 × 5 factorial, replicated 15× per machine |
| runs | 300 (150 per machine), ~72 h each machine |
| machines | a 4-core laptop and a multi-core server |
| stack | Python, FastAPI, Docker Compose, Locust, Scaphandre, Prometheus |
The question
Circuit breakers are standard advice. Wrap the call, trip the breaker when the downstream service starts failing, stop hammering something that is already down. Everyone repeats it. Almost nobody publishes what it costs.
I screened 44 papers on fault tolerance in microservices. Two measured energy at all, and neither measured it as a consequence of a pattern firing. That was the gap I built this for: not does a circuit breaker help, but what do you pay for the help, measured across the full range of failure severity, in latency, in availability, and in energy at the same time.
The short version, before the detail: a circuit breaker does not remove cost. It relocates it. When the dependency is fully down, it takes cost off latency and energy. When the dependency is only half down, it puts cost onto availability and throughput. Which regime you are in decides whether you want it, and most advice never mentions that there are two regimes.
What I built
A ten-service testbed, a reimplementation of Google’s Online Boutique in Python and FastAPI on Docker Compose. Seven services sit behind an application-level circuit breaker I wrote myself rather than pulled in, so every state transition is mine to log. It opens after 5 consecutive failures, waits 30 seconds, then admits traffic again and needs 2 clean successes before it closes.
Writing the breaker instead of importing one matters more than it sounds. When the thing you are measuring is the mechanism itself, a library is a black box with its own thresholds, its own probe policy, its own idea of what counts as a failure. Sixty lines I control means the numbers below are attributable to a state machine I can point at, not to a dependency’s internals.
Failures go in at Payment as instant HTTP 500s at a rate I set per run. Checkout depends on Payment, so a Payment failure is a real dependency failure travelling through the call graph, not a synthetic error at the edge. One design detail decides how the results read: on the read paths, an open circuit degrades gracefully, an empty product list, an empty cart, and the page still renders. Only checkout turns an open circuit into an error the user sees. So the breaker’s visible action is concentrated exactly on the path I inject into.
How I measured
Two factors. Breaker off or on, and Payment failing at 0, 25, 50, 75, 100 percent. Ten conditions. Locust drives 100 concurrent users for 30 minutes per condition. Energy comes off the CPU’s RAPL counters, read by Scaphandre and scraped into Prometheus every 2 seconds. The first 300 seconds of every run get cut so warmup never lands in a number. Availability counts an open-circuit rejection as a failure, because the user receives an error either way; that choice matters later.
Then two decisions that separate this from the version of this post I could have written a month ago.
I ran everything 15 times. All ten conditions, fifteen rounds, per machine. 150 experiments a machine, roughly 72 hours, checkpointed to a state log so a crashed run resumes instead of restarting. Every figure below is a mean with a 95 percent confidence interval behind it, not one lucky run. This was the single most important change, and I will show you exactly why in a moment, because one of my earlier findings did not survive it.
I ran it on two very different machines. A 4-core laptop and a multi-core server. Same protocol, same containers. A finding that shows up on one machine is a finding about that machine. A finding that shows up on both, with tight intervals on each, is a finding about the pattern. Everywhere below, “laptop” and “server” are two independent replications; I never average them, because they idle at 7.7 W and 20 W respectively and averaging watts across that gap would be meaningless. What I look for instead is agreement in direction.
What I found
It is a threshold, not a dial
Breaker opens per 30-minute condition, mean over 15 rounds.
| Payment failing | Laptop opens | Server opens | Chance any 5 in a row all fail |
|---|---|---|---|
| 0% | 0 | 0 | 0 |
| 25% | 1.9 | 2.3 | 0.1% |
| 50% | 31.7 | 33.3 | 3.1% |
| 75% | 52.1 | 53.3 | 24% |
| 100% | 57.1 | 57.6 | 100% |
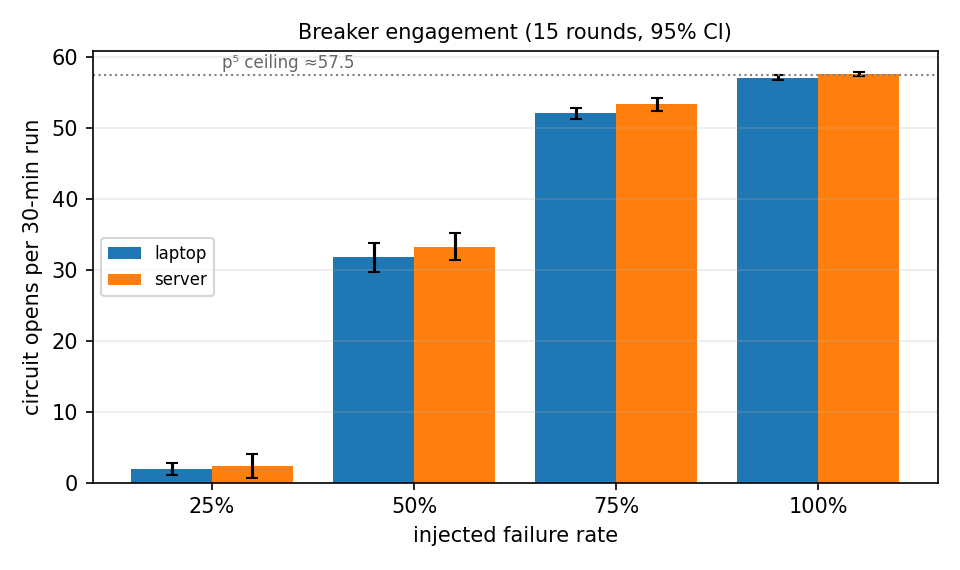
Flat, then a cliff. At 25 percent injected the breaker barely notices, about two opens in a full half hour. It needs 5 failures in a row, and at that rate a five-request window comes up all-bad roughly once in a thousand tries. A quarter of your checkouts are dying and the breaker sits there closed, doing nothing. That is not a misconfiguration. It is what a consecutive-failure counter means, and most people ship one without working out where its blind spot sits. If you need protection against a 25 percent failure rate, a consecutive-failure breaker is the wrong detector; you want a rate-over-a-window policy instead.
The top end is arithmetic, not behaviour. One open costs 30 seconds of cooldown plus about a second to trip again, so 1800 seconds of load divided by ~31 seconds a cycle caps you at about 57.5 opens. Both machines landed at 57. I find this the most convincing single result in the whole project, not because it is surprising, but because it is not: I predicted it from the configuration before running anything, and two different machines reproduced it to within one open across 15 rounds each. When the instrument does exactly what its specification says, you can trust everything it tells you afterward.
At total outage it earns its keep
Checkout p95 latency at 100% injected, breaker off → on.
| Machine | Off | On | Speedup |
|---|---|---|---|
| Laptop | 674 ± 41 ms | 193 ± 43 ms | 3.5× |
| Server | 425 ± 8 ms | 86 ± 3 ms | 4.9× |
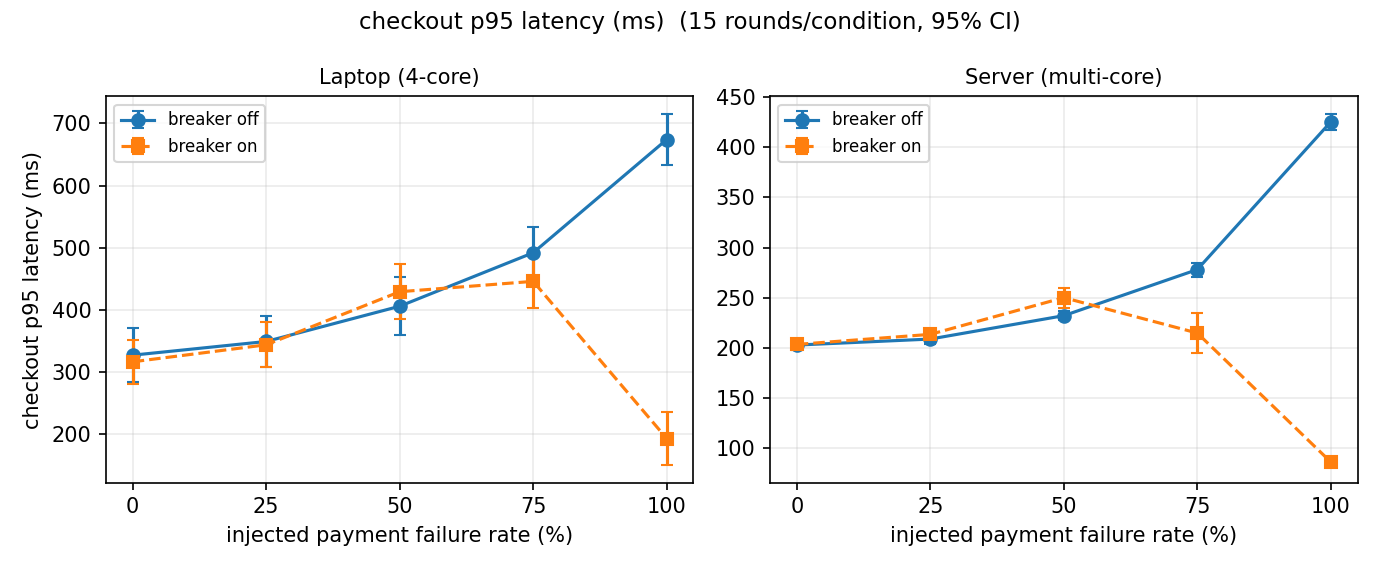
When Payment is completely down, the breaker does the thing it is famous for. Checkout tail latency drops by three-and-a-half to five times, and the confidence intervals do not come close to touching, so this is a real effect and not a fluke round.
The mechanism is worth stating precisely, because it is not the one the pattern is usually sold on. My injected failures return instantly. There are no hung requests, no timeout waits for the breaker to escape. What the open circuit skips is work: with the circuit open, the Frontend rejects the checkout before it fetches the cart, looks up every item, converts currencies, and gets a shipping quote on the way to a Payment call that was going to 500 anyway. That saved orchestration is the latency win. Which also means this number is a floor, not a ceiling. Against a real dependency that hangs until a multi-second timeout fires, the gap would be far wider, because then the breaker is escaping seconds of dead waiting on top of the skipped work.
At partial failure you pay for it
This is the half the standard advice leaves out.
Observed checkout failure at 50% injected, breaker off → on.
| Machine | Off | On |
|---|---|---|
| Laptop | 49.9 ± 0.5% | 76.0 ± 2.1% |
| Server | 50.5 ± 0.6% | 77.6 ± 1.9% |
At 50 percent injected, a checkout that actually reaches Payment still succeeds half the time. An open circuit rejects that coin flip. So observed checkout failure climbs to about 77 percent against 50 percent injected; the breaker itself manufactured the extra 27 points, because its rejections are errors the user sees and I count them there. On the laptop at 50 percent, of the ~768 requests the breaker rejected in an average round, roughly half would have gone through.
It shows up system-wide too, on both machines, with intervals that separate cleanly. At 50 percent, availability drops about 1.1 to 1.2 points and throughput drops 2.5 to 4.8 percent. At 75 percent the throughput gap widens to 5 to 8 percent. None of this is catastrophic, and that is exactly the point: it is a quiet, steady bill, charged precisely when the dependency is degraded rather than dead, which is the situation real incidents actually live in. Is a fast “no” better than a fifty-fifty “yes”? For a checkout with revenue attached, probably not. For a call with a cheap fallback, probably yes. The breaker cannot make that judgment. A person has to, and the data says they have to make it in exactly the regime where it is hardest.
The failure spread through the cart, not the thread pool
This one I did not plan for, and it is my favourite result.
The standard cascade story is blocked threads and exhausted connection pools. That is not what happened here, my services are async, so a waiting request parks a cheap continuation frame, not a thread. And yet, at 50 and 75 percent injected, everything got slower, browsing pages that never touch Payment, while the machine drew less total work. Less work, higher latency. That combination demands an explanation, and the per-endpoint data has one.
Carts empty only after a payment succeeds. So every suppressed checkout leaves its cart intact, and the simulated users keep shopping. The cart view fans out one catalog call per item, so as the carts grow over 30 minutes, the cost of every cart view grows with them. Inside a single run, /cart mean latency went from about 295 ms in the first five minutes to 2,305 ms in the last five. The ordering across conditions confirms it: whatever kills checkout success, breaker rejections or 100 percent injection with no breaker at all, produces the same inflation. The breaker’s only role is that it suppresses the successful checkouts that were quietly draining the carts.
The magnitude here is an artifact of my workload, real users abandon a broken shop, they do not add to a cart for half an hour. But the mechanism is general and I think it is the most interesting thing in the project. The failure propagated through persistent application state, not through any blocked resource. No standard cascade model describes that path, and no metric watching only the protected call would ever have caught it. If you fail fast at one edge of a system, check what that does to state everywhere else, because that is the wire the damage can travel down.
Same watts, more joules per useful transaction
Here is where 15 rounds changed my mind.
Raw host power, breaker off → on. Laptop first, server second.
| Payment failing | Laptop | Server |
|---|---|---|
| 0% | +0.0% | +0.0% |
| 25% | +0.6% | +0.3% |
| 50% | +1.3% | +4.8% |
| 75% | +0.5% | +4.3% |
| 100% | +0.8% | −0.5% |
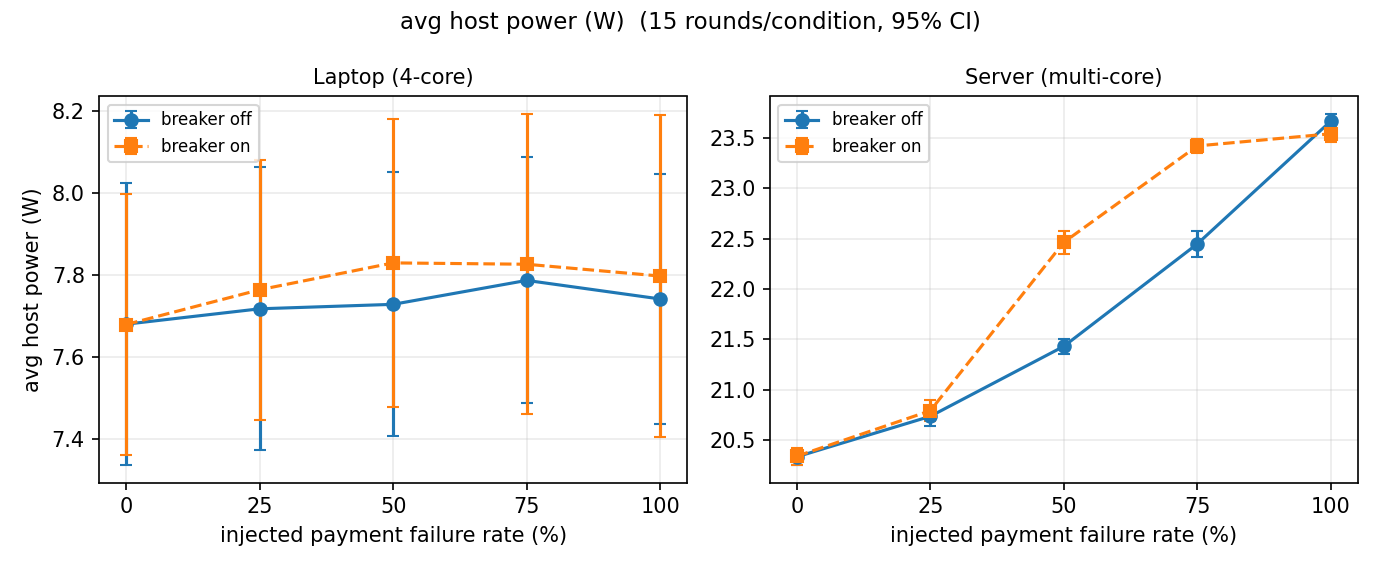
An earlier single run had suggested the breaker drew up to 11 percent less power. Fifteen rounds killed that finding outright. On the laptop, raw power moves less than 1.3 percent at every intensity and every confidence interval crosses zero: the breaker does not measurably change how much power the machine draws. The −11 percent was noise from a single lucky run, and I only know that because I stopped trusting single runs.
But look at the server column. On a machine with spare cores, the breaker’s constant cycling, opening, probing, rejecting, at partial failure does cost measurable power, +4 to +5 percent, with intervals that separate. The laptop could not show this because its 4 cores were already saturated; there was no headroom for the extra work to express itself. Two hardware profiles, and the raw-power picture differs between them, which is precisely the kind of thing you only see if you run on more than one machine.
The metric that agrees on both is energy per successful request:
Energy per successful request, breaker off → on.
| Payment failing | Laptop | Server |
|---|---|---|
| 0% | ~0 | ~0 |
| 25% | +0.7% | +0.4% |
| 50% | +7.6% | +8.8% |
| 75% | +10.6% | +11.1% |
| 100% | ~0 | ~0 |
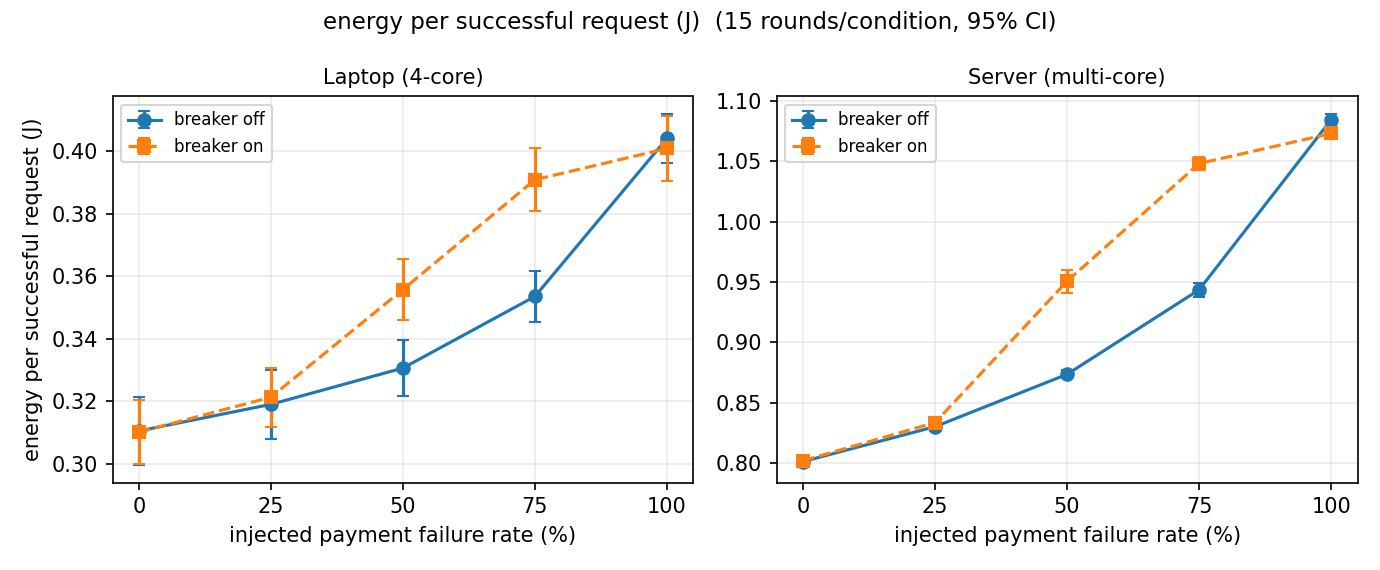
Normalise energy against useful work and the story is clean and identical on both machines. At 0 and 100 percent the two modes cost the same per transaction. At partial failure the breaker costs 8 to 11 percent more energy per completed transaction, on both machines, intervals separating on both. The reason is the availability cost from earlier: the machine draws roughly the same power, but the breaker is destroying successes, so the denominator shrinks faster than the numerator. It does not save energy. It changes how much useful work the energy buys, and at partial failure it buys less.
This is a sharper result than the one I lost. “Circuit breakers save 11 percent power” would have been a nice headline and it was wrong. “Circuit breakers cost 8 to 11 percent more energy per completed transaction at partial failure, replicated on two machines” is less catchy, true, and actually useful.
What it adds up to
The breaker relocates cost. At total outage it takes cost off latency (3.5 to 5× faster checkout tails) and off availability (the requests it rejects were doomed anyway), essentially free protection. At partial failure it puts cost onto availability, throughput, and energy per transaction, a steady bill, charged in exactly the regime where the right call is least obvious. Both halves reproduced on two machines with 15 rounds each.
So the practical advice is not “enable circuit breakers everywhere.” It is three decisions the pattern cannot make for you:
- Match the detector to the failure rates you care about. A five-consecutive-failure breaker is blind to a 25 percent failure rate. If that rate matters to you, count failures over a window instead.
- Decide what a rejection is worth. At partial failure the breaker discards requests with a real chance of success. That is a good trade with a fallback and a bad one for a checkout. It is a product decision, not a default.
- Audit what failure does to your state. The nastiest thing I found was not a blocked thread. It was carts that never drained taxing pages that had nothing to do with the failure. Fail-fast at one edge can raise costs at another, through state, silently.
And one methodological note that I would not have believed before doing this: run it more than once, and run it on more than one machine. A single run handed me a clean, wrong, flattering result about power. Fifteen rounds on two machines took it away and handed back something truer in its place. That trade is the whole reason the rest of these numbers are worth reading.
The interactive breaker simulator below is an idealised model of the same state machine. It reproduces the shape of the measured curves, not the absolute numbers, because it has no network, no queueing, and no real service behind it.